
Carbon AI
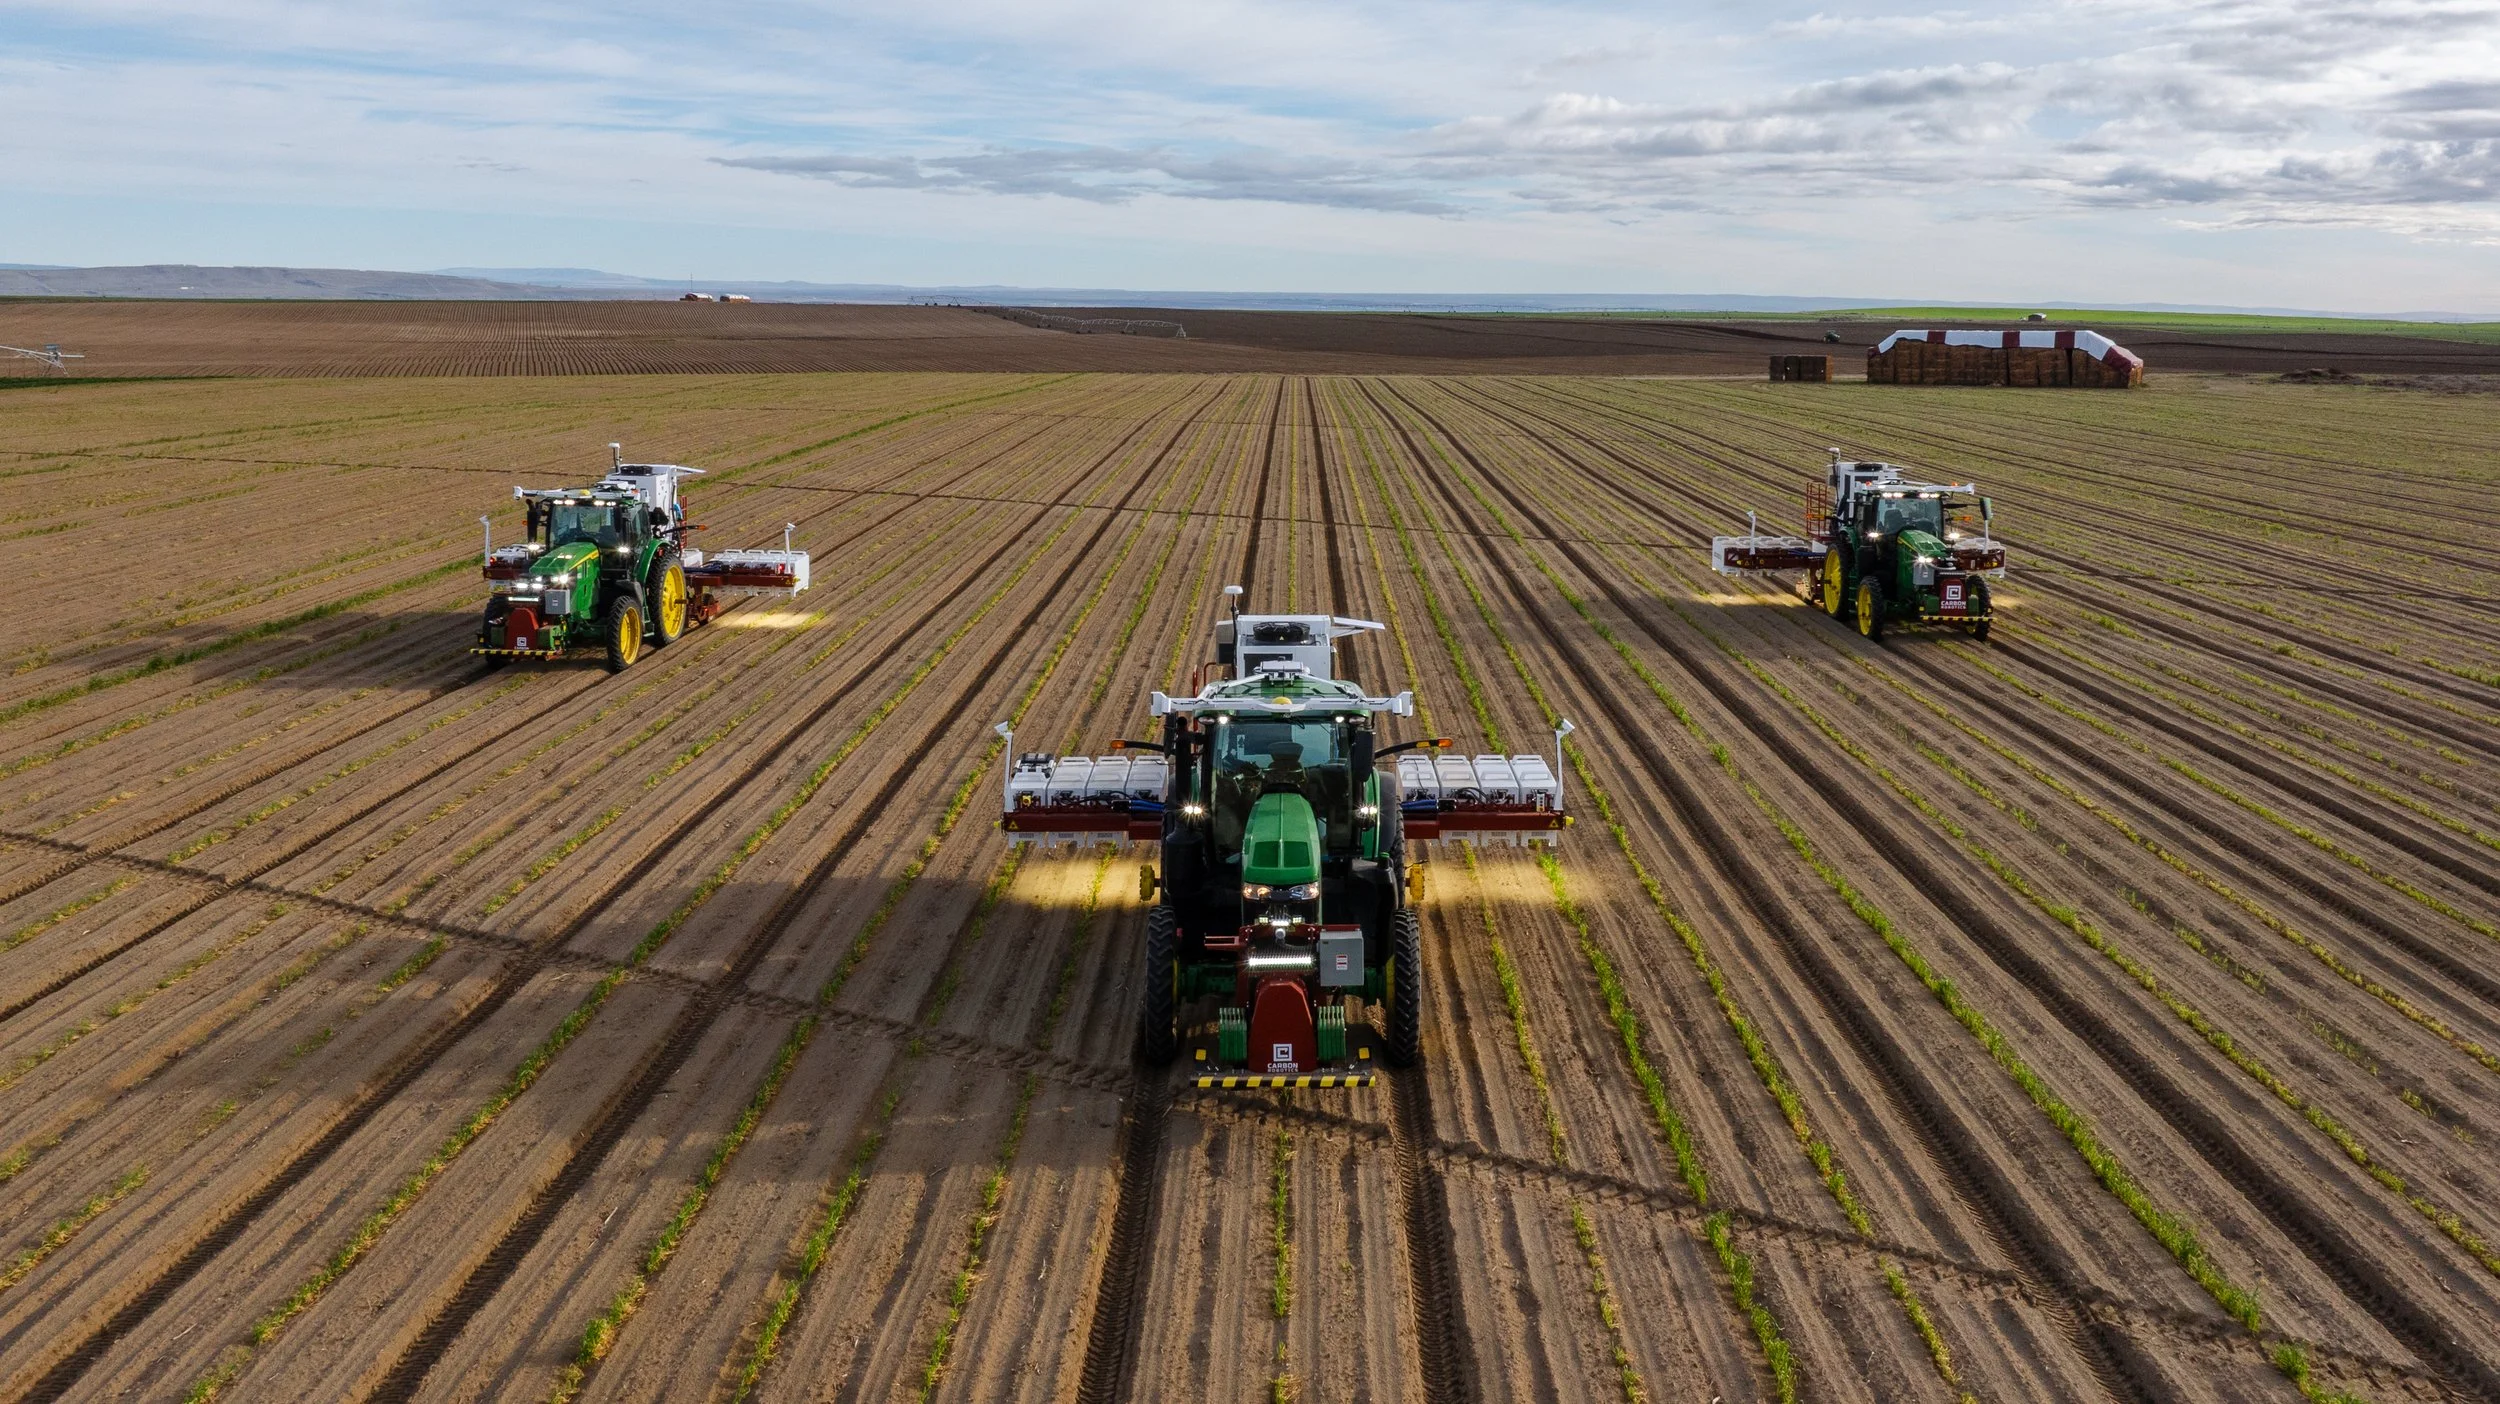
Start weeding any field or crop in minutes
Carbon AI is powered by our Large Plant Model (LPM) — trained on the world's largest, most diverse, and fastest growing agricultural dataset collected by LaserWeeders around the world.
Compounding
Data Flywheel
All LaserWeeders continuously feed real-world data back — strengthening our Large Plant Model (LPM) exponentially. The more machines in the field, the smarter every machine gets.
Every pass captures labeled plant and weed data from real fields across 15 countries.
Data feeds back into the Large Plant Model, continuously improving detection accuracy.
Model improvements are deployed to all LaserWeeders in the field automatically.
Large Plant Model + Plant Profiles Overview
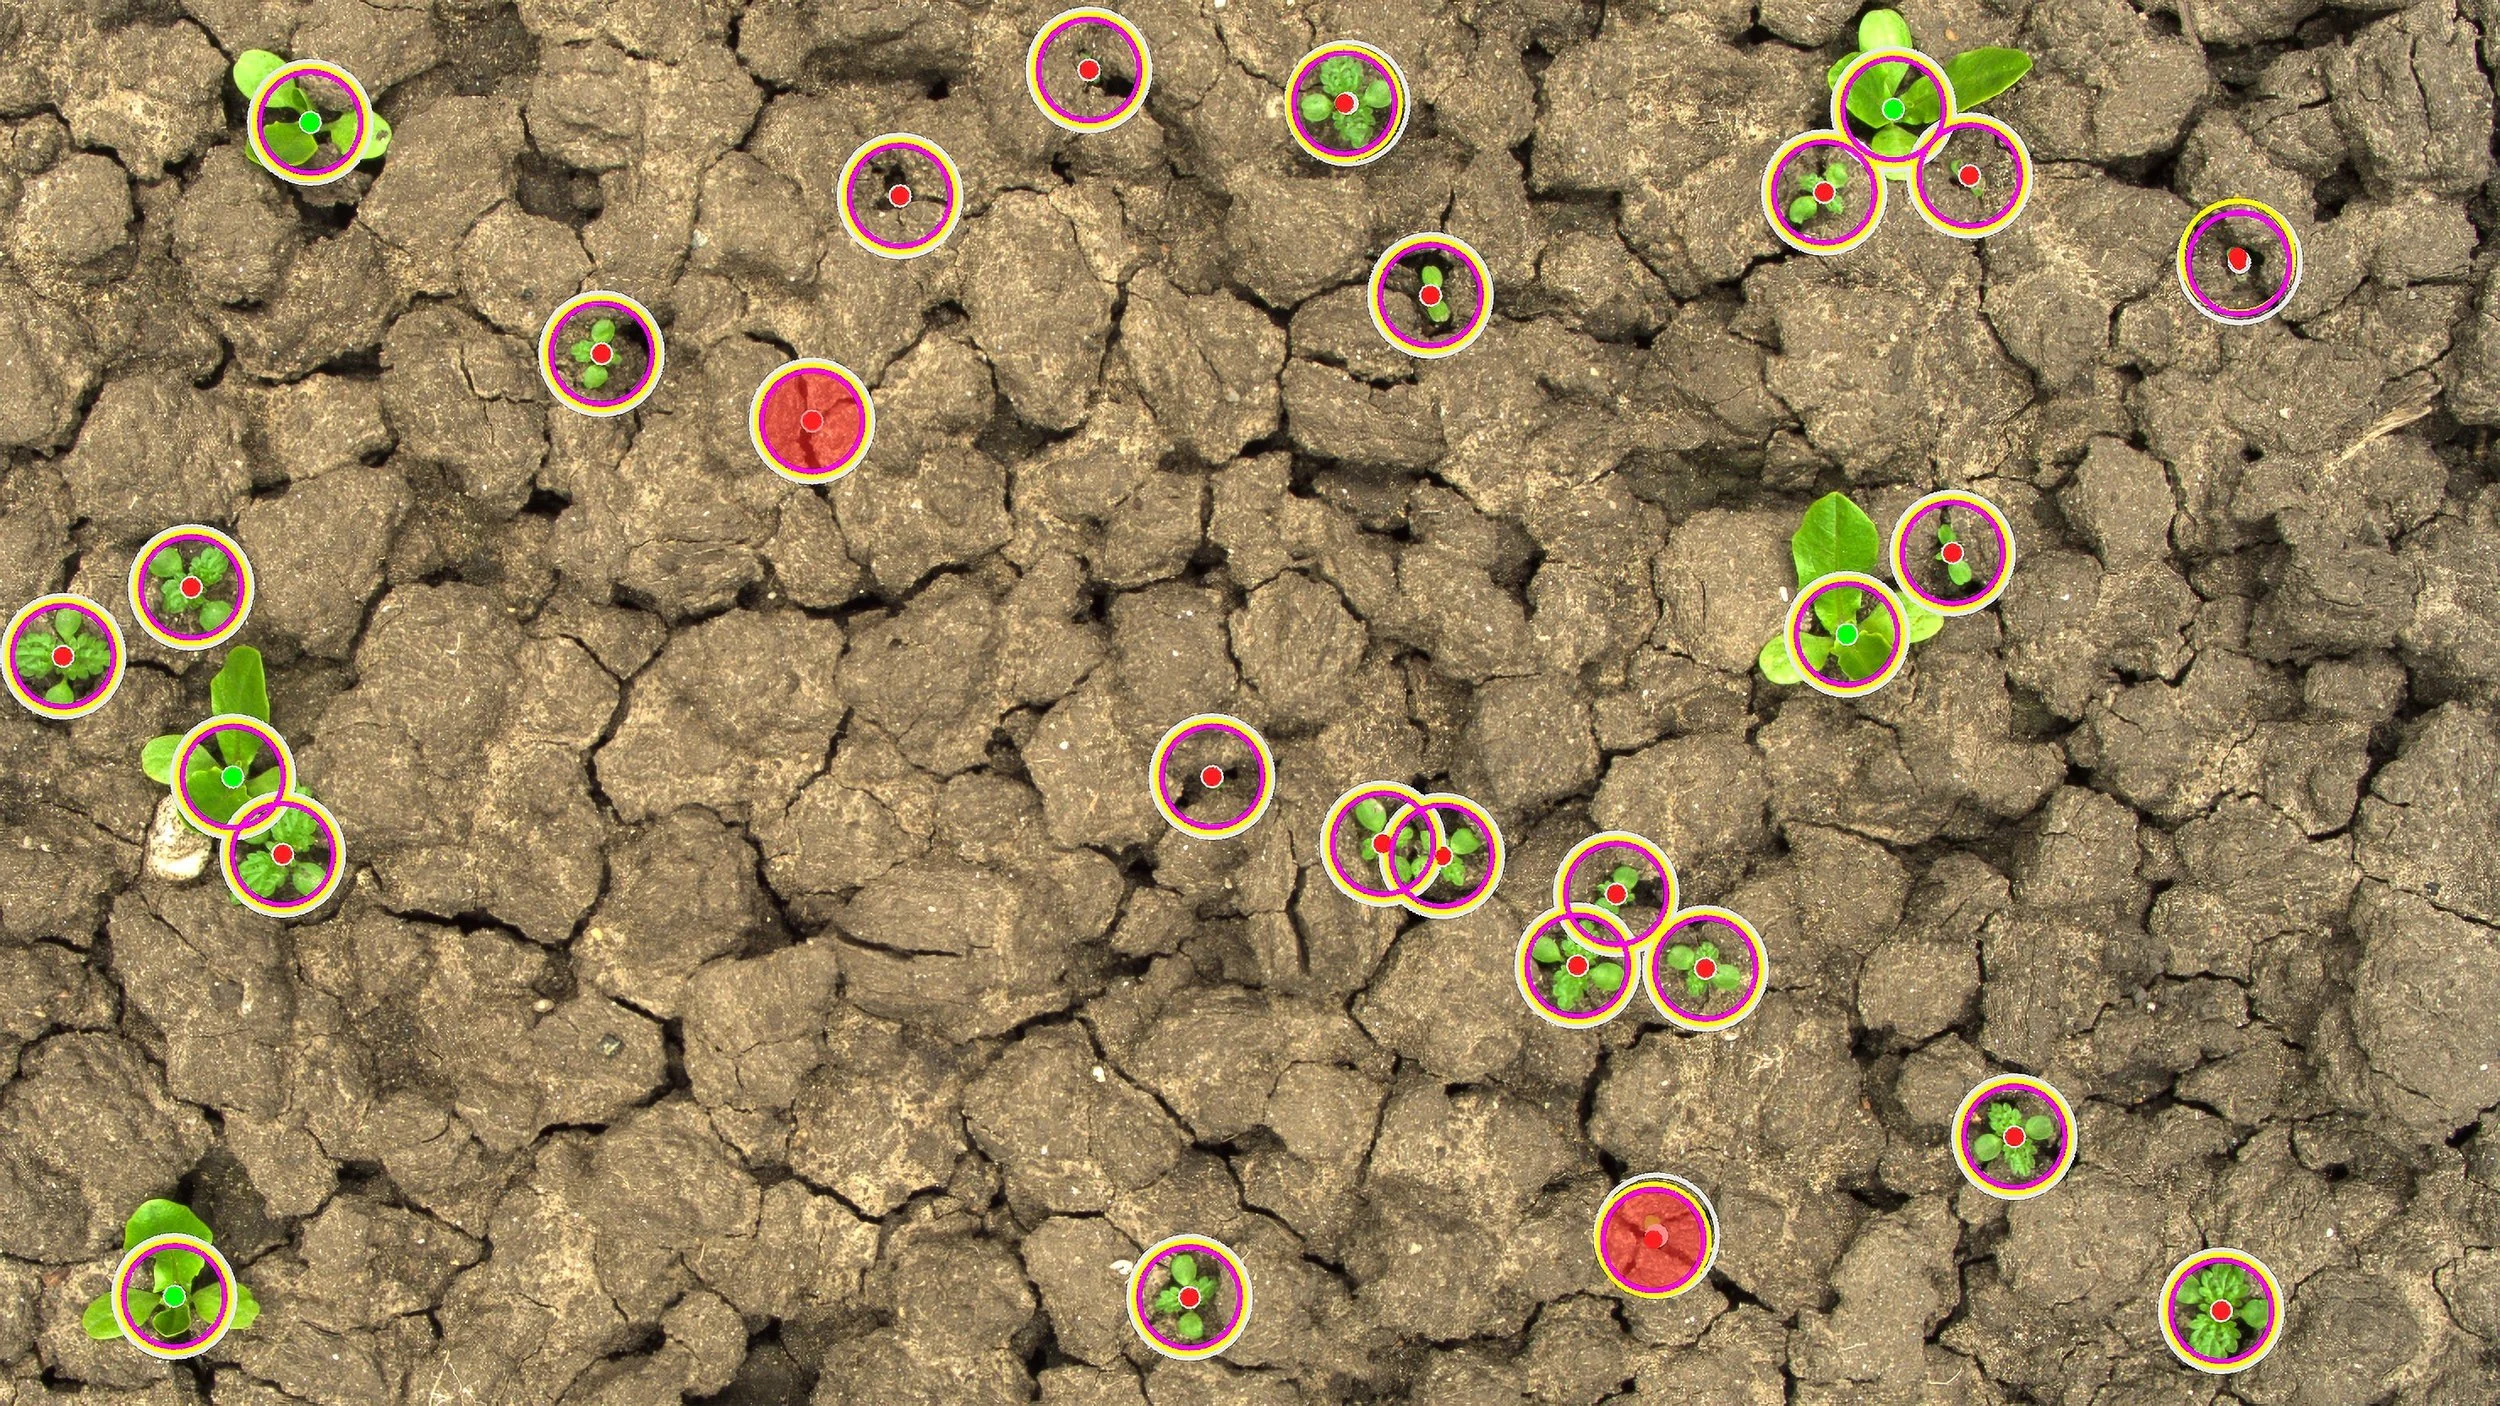
The World's First Large Plant Model
Trained on 150 million labeled plants, our Large Plant Model enables farmers to start laser weeding any field or crop in minutes. And with Plant Profiles, the LPM can be tailored to unique fields in real-time — no waiting, no downtime.
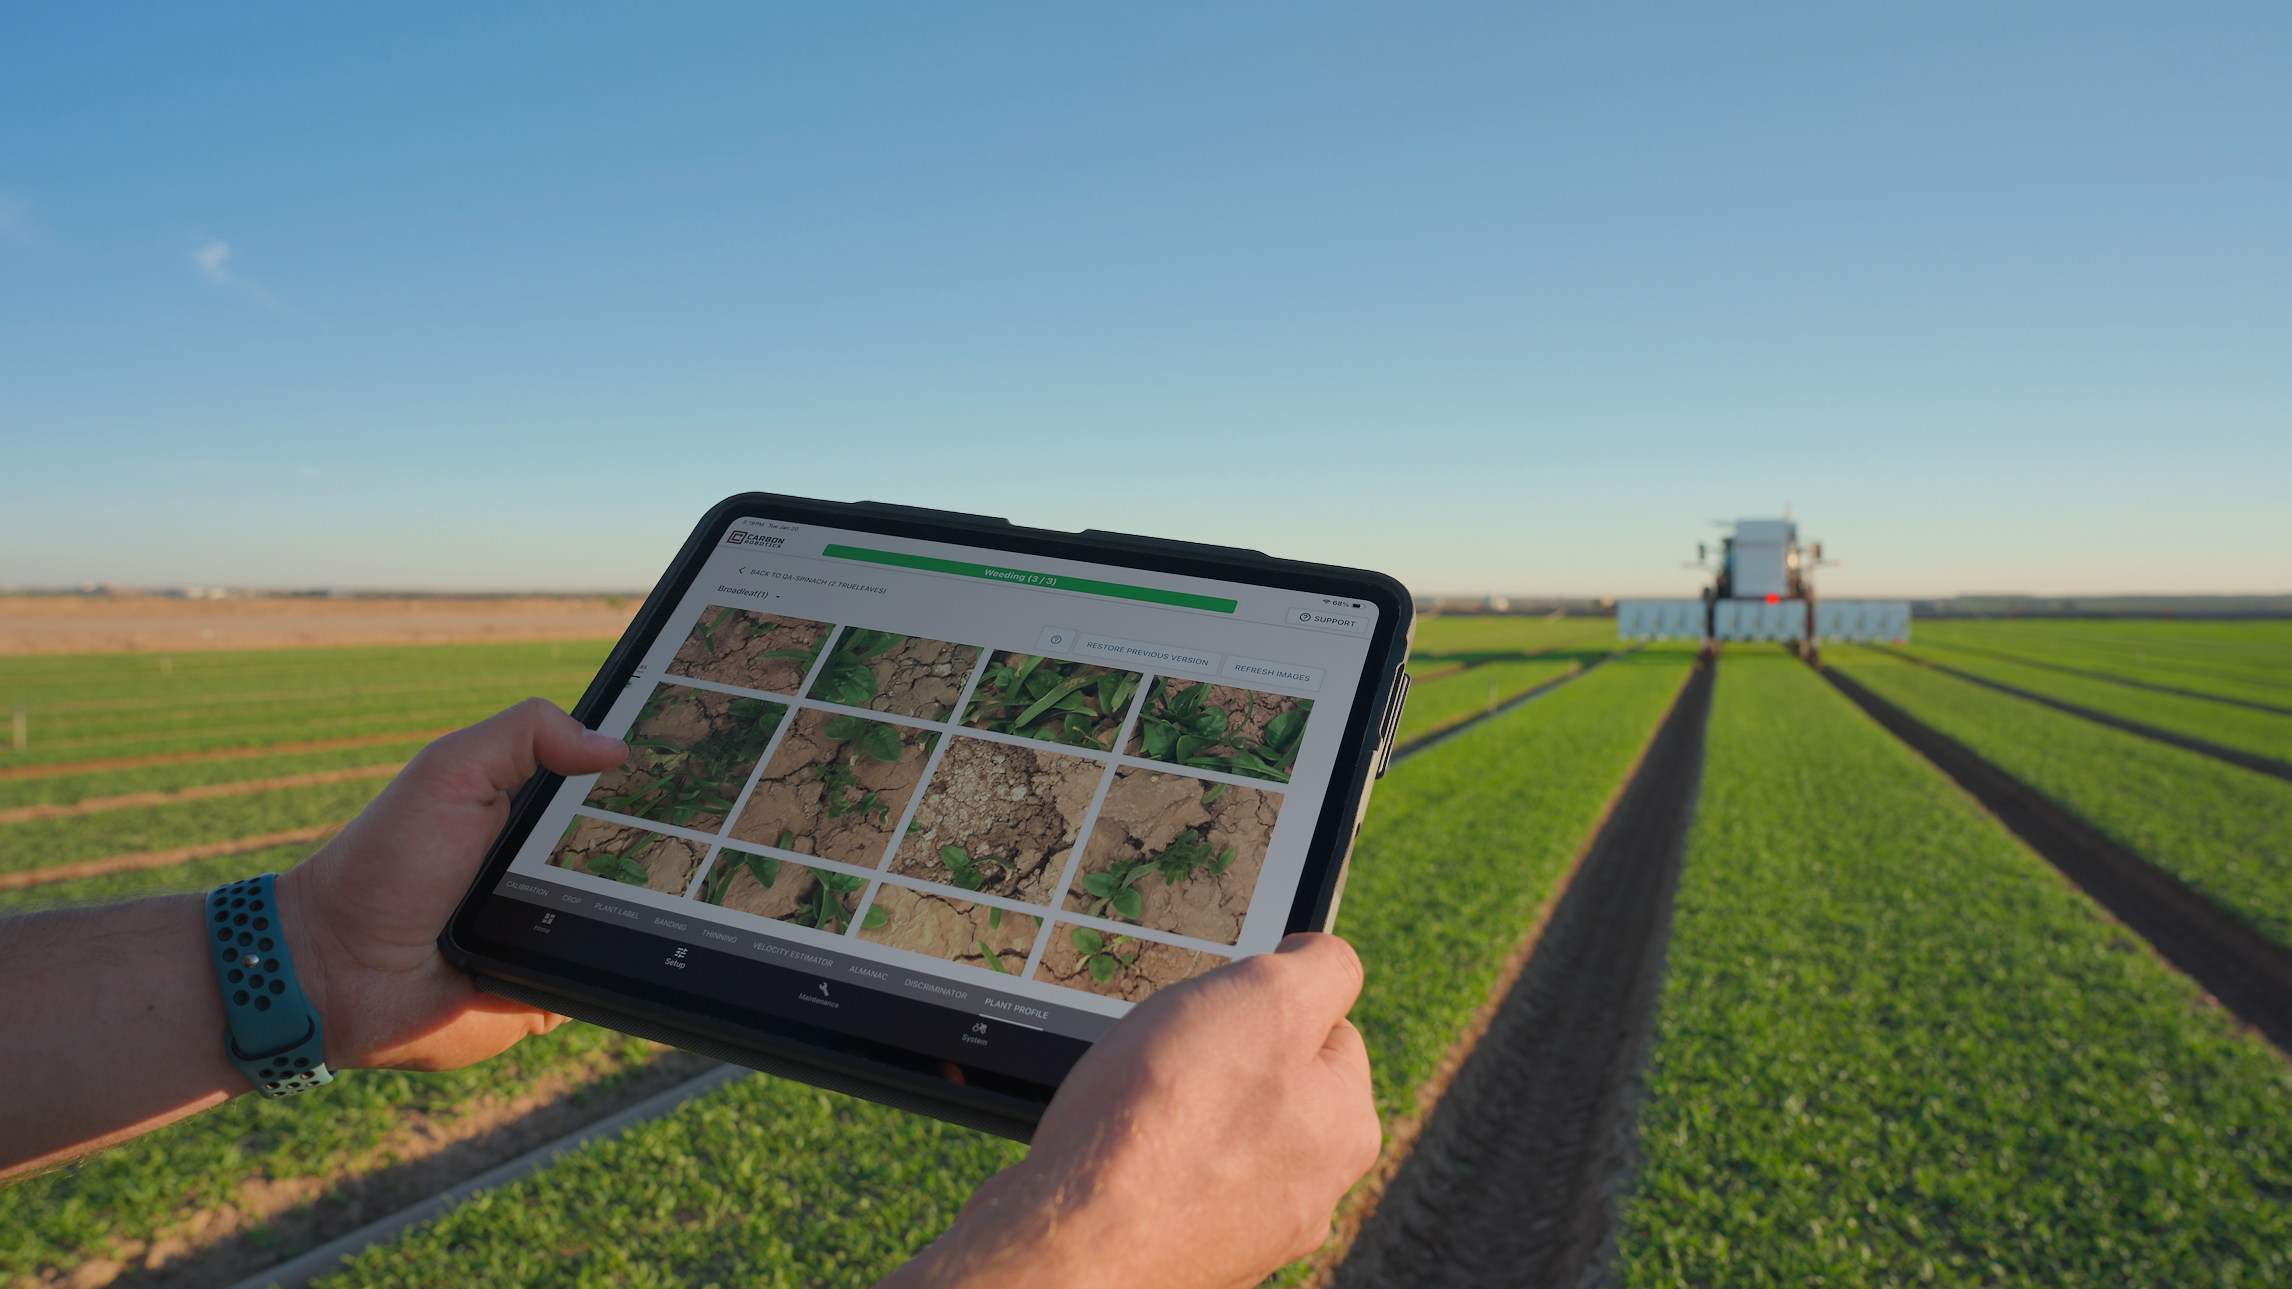
Plant Profiles
Tailor the LaserWeeder for your unique fields. Customize model behavior for specific crops and weed pressure in minutes, not days.
Take photos of your field to define the crop and weed conditions you're working with.
Carbon AI adjusts model behavior in real time. No waiting, no downtime.
Your machine is now precision-tuned for your specific field and weed pressure.
What Growers Are Saying
We grow 13 different crops on the farm, and I use eight different plant profiles on them. Being able to target specific weeds has really worked for us, and the operators have found it very easy to pick up.
We use plant profiles in our Vidalia onion seed beds, transplants, and direct seeded onions. This has been a game changer for us, and the simple, user-friendly platform allows our operators to maximize LaserWeeder performance in real time.
Here in Scotland, we have a very short growing season, so timing is critical. Plant Profiles let us add a few images to tailor the model, and we saw the improvements take effect in minutes. We need changes to happen immediately.
This is the best update Carbon has put out yet. Plant Profiles let us train the machine to only go after problematic weeds in real time, and it's working great across all of our LaserWeeders.
Control. Monitor. Optimize.
AI-Powered
Farm Operations
Actionable visualized data to monitor and optimize your operations — coverage maps, weed analytics, and performance metrics all in one place.
- Count & Density
- Size & Type
- Heat Maps
- Spatial Data
- Kill Rate & Number Killed
- Coverage & Speed
- Acres Covered
- Total Performance

Real-Time Remote
Insights
Empowering farm managers and operators with real-time remote insights into their LaserWeeder's status, location, and performance. Available on iOS and Android in nine languages.
- Multimedia Group Chat
- LaserWeeder Location & Daily Metrics
- Acres Covered, Weeds Killed, Travel Speed
- Crop & Weed Count, Density, Size, Type


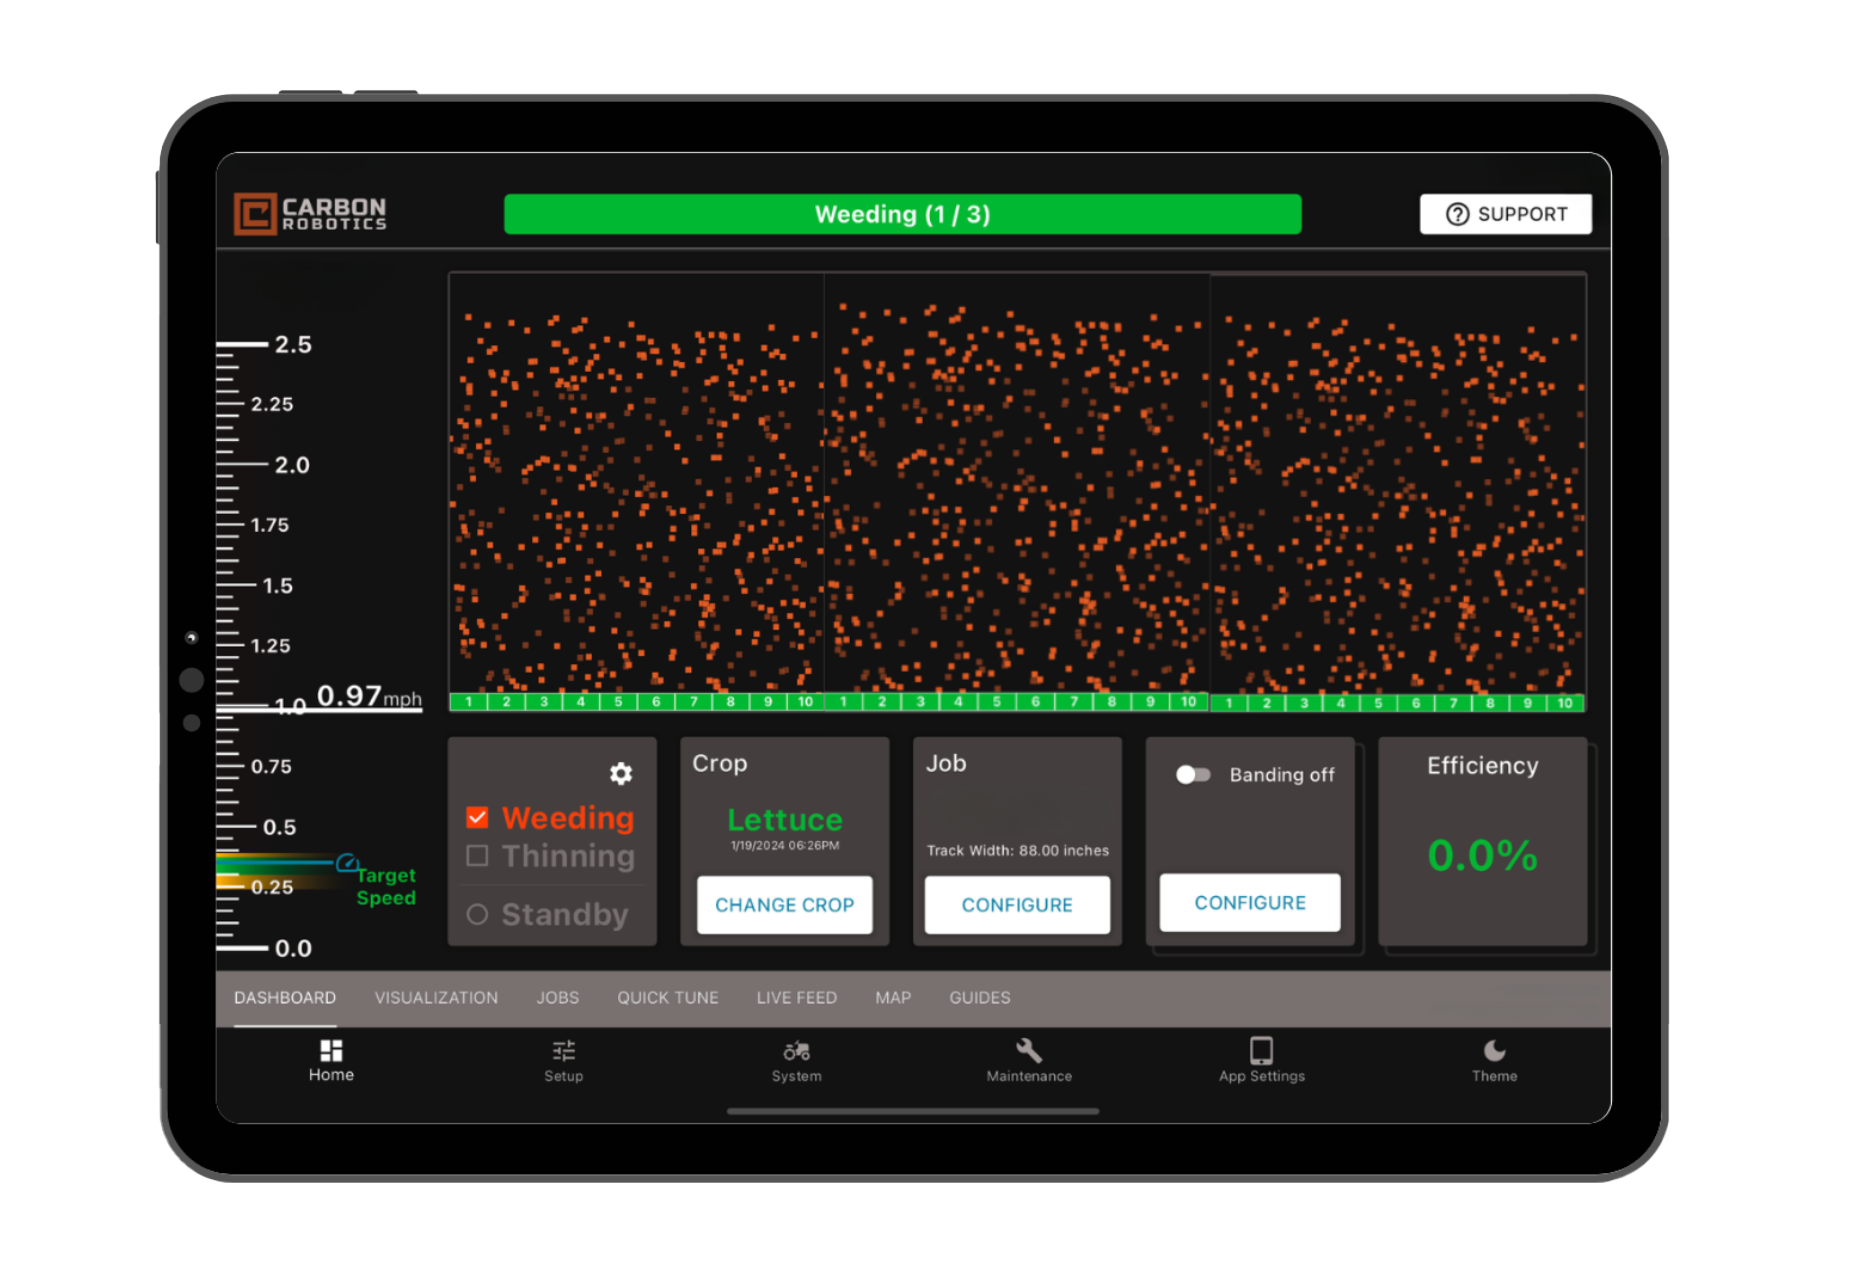
Control & Customize
Your Weeding Experience
A purpose-built iPad app giving operators full control of the LaserWeeder — from a single tap to start, to deep customization of weeding parameters.
- Select "Crop" and push "Start"
- Customize weeding parameters
- One-button contact Support
- Available in 14 languages
Furrow Following
Carbon Autonomy uses Carbon AI for precise row alignment and seamless re-entry after end-of-row turnarounds.